Spring Boot App Metrics with Micrometer and Prometheus
Observability, in the context of computer systems and software development, refers to the ability to gain insights into the internal state and behavior of a system based on the external outputs, metrics, logs, and traces it generates.
Key components of observability include:
- Metrics: These are quantitative measurements that provide data about the system’s performance and behavior, such as CPU usage, memory consumption, request/response times, and error rates.
- Logs: Text-based records of events, actions, and messages generated by the system. Logs can help in identifying specific actions taken by the system and understanding the flow of events.
- Traces: Traces follow the path of a specific request or transaction through the system, capturing data about each step it takes and the services or components it interacts with. This is particularly valuable in distributed systems.
In this blog we will see how to generate metrics which is one of the pillars of Observability using Micrometer.
Micrometer is a widely used open-source library in the Java ecosystem that provides a simple and flexible way to instrument code for collecting application-level metrics. It is designed to integrate with various monitoring systems and tools, making it easier to measure and observe the behavior of Java applications. Micrometer is commonly used for building observability and monitoring capabilities into applications, allowing developers to collect and visualize metrics to gain insights into performance, behavior, and other relevant aspects of the application. Micrometer seamlessly integrates with Spring Boot’s Actuator module, making it easy to expose metrics and health checks.
Prometheus is a monitoring system and time series database which will be used to store the metrics created using micrometer.
We will do the following things
i) Define a simple REST API
ii) Collect metrics using Micrometer
iii) Run Prometheus as docker container using spring support for docker compose
iv) Configure Prometheus to pull the metrics and store it
v) View the App metrics in Prometheus
We can create the spring project using Spring initializr with the dependencies as shown below

Next define a simple REST API
@RestController
public class MetricsController {

	@GetMapping("/greet/{name}")
	public String greet(@PathVariable String name) {
		return "Hello " + name;
	}
}
Add the below dependency for docker compose in Spring Boot
<dependency>
    <groupId>org.springframework.boot</groupId>
    <artifactId>spring-boot-docker-compose</artifactId>
</dependency>
Configure application.properties to enable endpoint and docker compose
management.prometheus.metrics.export.enabled=true
management.endpoint.prometheus.enabled=true
management.endpoints.web.exposure.include=prometheus,health,info,metric
spring.docker.compose.enabled= true
spring.docker.compose.file= docker-compose.yml
The metrics will now be available at http://localhost:8080/actuator/prometheus
As a next step we will run Prometheus as docker container and add required configuration for Prometheus to scrape the metrics over HTTP.
Docker compose file to run Prometheus as docker container:
The required scrape config is provided in the prometheus.yml file.
version: "3.7"
services:
  prometheus:
    image: prom/prometheus:latest
    volumes:
            - ./prometheus.yml:/etc/prometheus/prometheus.yml
    ports:
      - 9090:9090
Prometheus expects to scrape or poll individual app instances for metrics. Spring Boot provides an actuator endpoint available at /actuator/prometheus to present a Prometheus scrape with the appropriate format.
scrape config in prometheus.yml:
Replace IP_ADDR with the IP address of the machine where Spring boot app runs.
global:
scrape_interval: 10s
scrape_configs:
- job_name: 'spring_micrometer'
metrics_path: '/actuator/prometheus'
scrape_interval: 5s
static_configs:
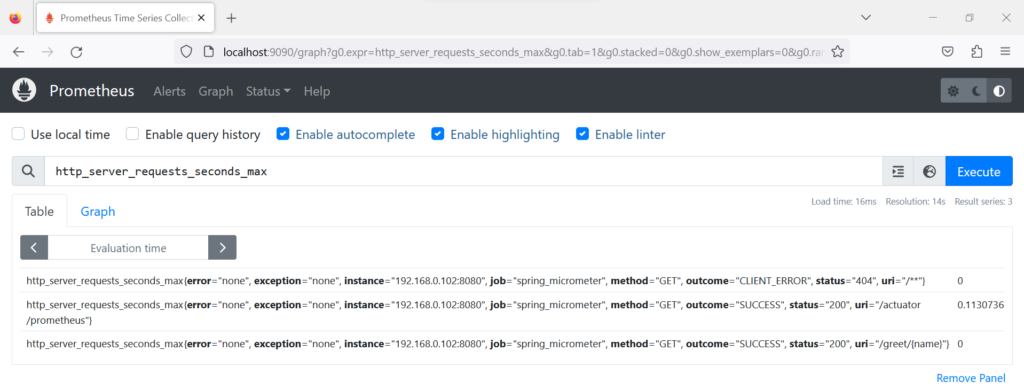
- targets: ['<IP_ADDR>:8080']Finally we can view the metrics in Prometheus running on localhost:9090. As a sample lets search for metrics http_server_requests_seconds_max.
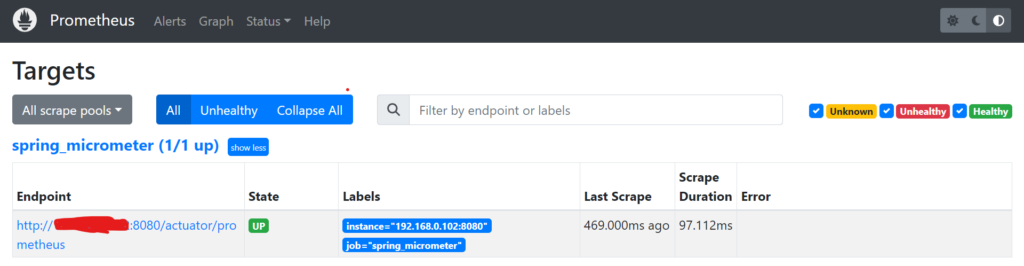
To check if Prometheus is correctly configured to talk with our Spring Boot app navigate to status->Targets
For source code head to https://github.com/MMahendravarman/Springboot_Examples
Leave a Reply