Spring Boot App metrics with Micrometer and New Relic
In this blog we will see how to send metrics created using micrometer to new relic.
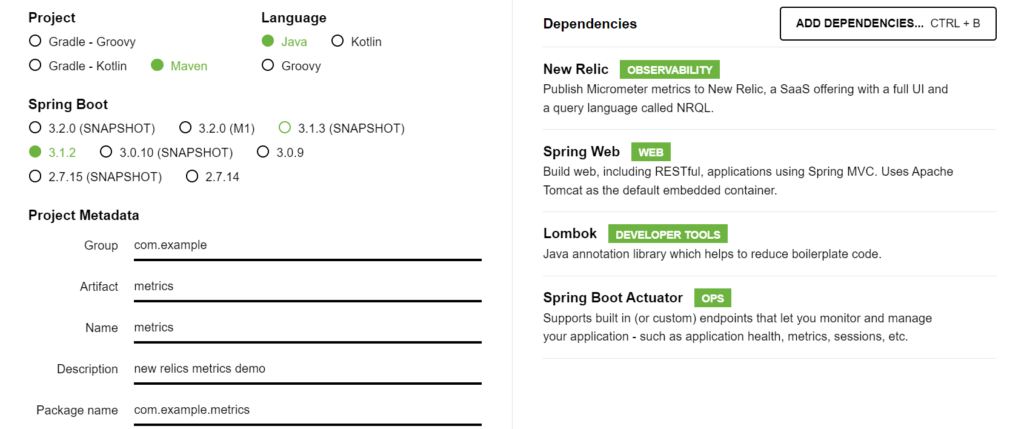
We can create the spring project using Spring initializr with the dependencies as shown below
Next define a simple REST API
@RestController
public class MetricsController {

	@GetMapping("/greet/{name}")
	public String greet(@PathVariable String name) {
		return "Hello " + name;
	}

}
Configure application.properties to enable endpoint and export to new relic
management.newrelic.metrics.export.account-id=${ACCOUNT_ID}
management.newrelic.metrics.export.enabled=true
management.newrelic.metrics.export.step= 30s
management.newrelic.metrics.export.api-key=${API_KEY}
logging.level.io.micrometer.newrelic=TRACE
spring.application.name=metricsdemo
management.endpoints.web.exposure.include=*
management.endpoint.health.show-details=always
management.metrics.distribution.slo.http.server.requests = 1ms,5ms
From the logs we could see metrics being sent to new relic for every 30s as configured in properties
2023-08-24T21:16:10.794+05:30 INFO 32060 --- [ main] com.example.metrics.MetricsApplication : Starting MetricsApplication using Java 17.0.1 with PID 32060 (C:\Users\mahen\Downloads\metrics\metrics\target\classes started by mahen in C:\Users\mahen\Downloads\metrics\metrics)
2023-08-24T21:16:10.797+05:30 INFO 32060 --- [ main] com.example.metrics.MetricsApplication : No active profile set, falling back to 1 default profile: "default"
2023-08-24T21:16:11.947+05:30 INFO 32060 --- [ main] o.s.b.w.embedded.tomcat.TomcatWebServer : Tomcat initialized with port(s): 8080 (http)
2023-08-24T21:16:11.963+05:30 INFO 32060 --- [ main] o.apache.catalina.core.StandardService : Starting service [Tomcat]
2023-08-24T21:16:11.963+05:30 INFO 32060 --- [ main] o.apache.catalina.core.StandardEngine : Starting Servlet engine: [Apache Tomcat/10.1.11]
2023-08-24T21:16:12.082+05:30 INFO 32060 --- [ main] o.a.c.c.C.[Tomcat].[localhost].[/] : Initializing Spring embedded WebApplicationContext
2023-08-24T21:16:12.082+05:30 INFO 32060 --- [ main] w.s.c.ServletWebServerApplicationContext : Root WebApplicationContext: initialization completed in 1218 ms
2023-08-24T21:16:12.152+05:30 INFO 32060 --- [ main] i.m.c.instrument.push.PushMeterRegistry : publishing metrics for NewRelicMeterRegistry every 30s
2023-08-24T21:16:12.833+05:30 INFO 32060 --- [ main] o.s.b.a.e.web.EndpointLinksResolver : Exposing 13 endpoint(s) beneath base path '/actuator'
2023-08-24T21:16:12.934+05:30 INFO 32060 --- [ main] o.s.b.w.embedded.tomcat.TomcatWebServer : Tomcat started on port(s): 8080 (http) with context path ''
2023-08-24T21:16:12.951+05:30 INFO 32060 --- [ main] com.example.metrics.MetricsApplication : Started MetricsApplication in 2.509 seconds (process running for 3.318)
2023-08-24T21:16:41.299+05:30 DEBUG 32060 --- [trics-publisher] i.m.n.NewRelicInsightsApiClientProvider : successfully sent 75 metrics to New Relic.
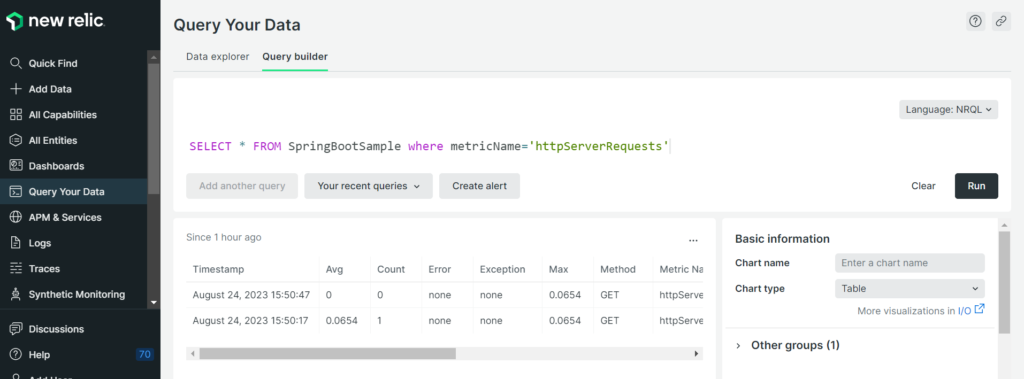
2023-08-24T21:17:08.736+05:30 DEBUG 32060 --- [trics-publisher] i.m.n.NewRelicInsightsApiClientProvider : successfully sent 75 metrics to New Relic.In the new relic we can query our metrics
Leave a Reply